I know there’ll be some of you who turn off when faced with graphs and charts. Because they’re so useful, though, I’d like you to persevere with them. You can get a lot from them once you can relate them to something real – that’s what I’d like to try and do here.
We can all tell the difference between noise and music (although where the boundaries lie can be a matter of opinion and circumstance). First an example of noise – the sound of surf on a beach:
And next the musical sound of a singing wineglass:
Now here are the sound spectra charts of each one for comparison, beach first:

Beach noise
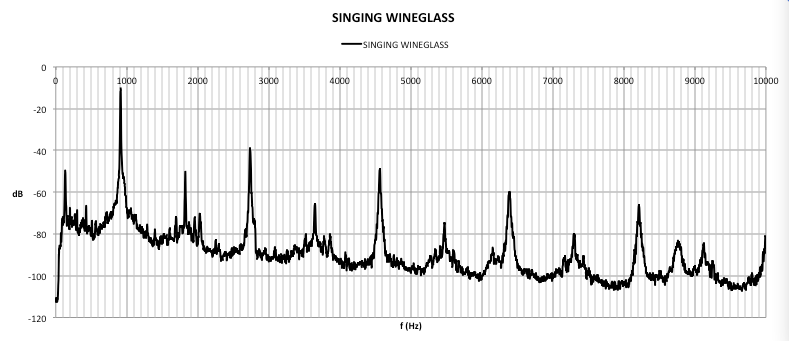
Singing wineglass
The horizontal axis of the graph shows frequency (pitch, in everyday terms), and the vertical axis shows loudness at each frequency.
The difference between the two sounds is very clear to the ear, and you can see it is also very clear from their sound spectra. Noise blasts out fairly evenly across a wide part of the sound spectrum, where a musical note has a series of well-defined peaks, often evenly spaced as in the wineglass example.
The value of the charts is that you can actually read off the frequencies of the main frequency peaks, and so compare different sounds more analytically than listening allows.
Here is another example: the noise of an electric kitchen mixer compared to the sound of a tubular gong of the sort you’ll find in wind chimes.
Here’s how the two look when you analyse them, the kitchen mixer in blue and the chime in red (I’ll leave you to imagine the sounds):

The chart shows the sound level put out by each. One is a maddening noise, the other is a pleasant ring (unless small children get hold of it), and the chart makes the difference as clear visually as it is to your ears.
The chime produces its loudest tones at well-defined frequencies, where the mixer blasts it out right across the spectrum, with one peak at around 400Hz which could well be related to the speed of the motor. We could all hum a note to match the gong, and maybe with the mixer too, probably somewhere between G and G#, which is at the 400Hz peak.
One interesting aspect of the gong signature is that each peak is double. That’s because the gong has a split along it at the bottom, giving it two fundamental frequencies instead of just one.
Charts like this can help a lot in understanding music. The singing wineglass is one of the purest sounds you’re likely to hear (this is a different wineglass than before with a different fundamental frequency, but the same type of spectrum):
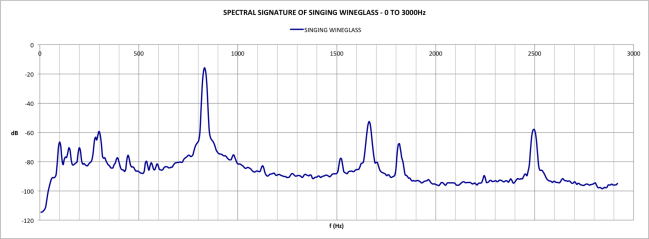
This shows that the singing glass puts out sound strongly at some very well-defined frequencies: 709Hz, 1664Hz,1816Hz, and 2496Hz. These correspond reasonably closely to the scale notes F5, G#6, A6, and D#7 (the number refers to which octave each note belongs to). Notice that even a “pure” sound contains more than one musical note.
Thoughtlessly, the makers of the glass didn’t take the time to tune the glass to the standard musical pitches.
By contrast, I tuned the 2nd string of my Jumbo 6 guitar to the note B3 at 246.9Hz:
Here’s the analysis of the note:
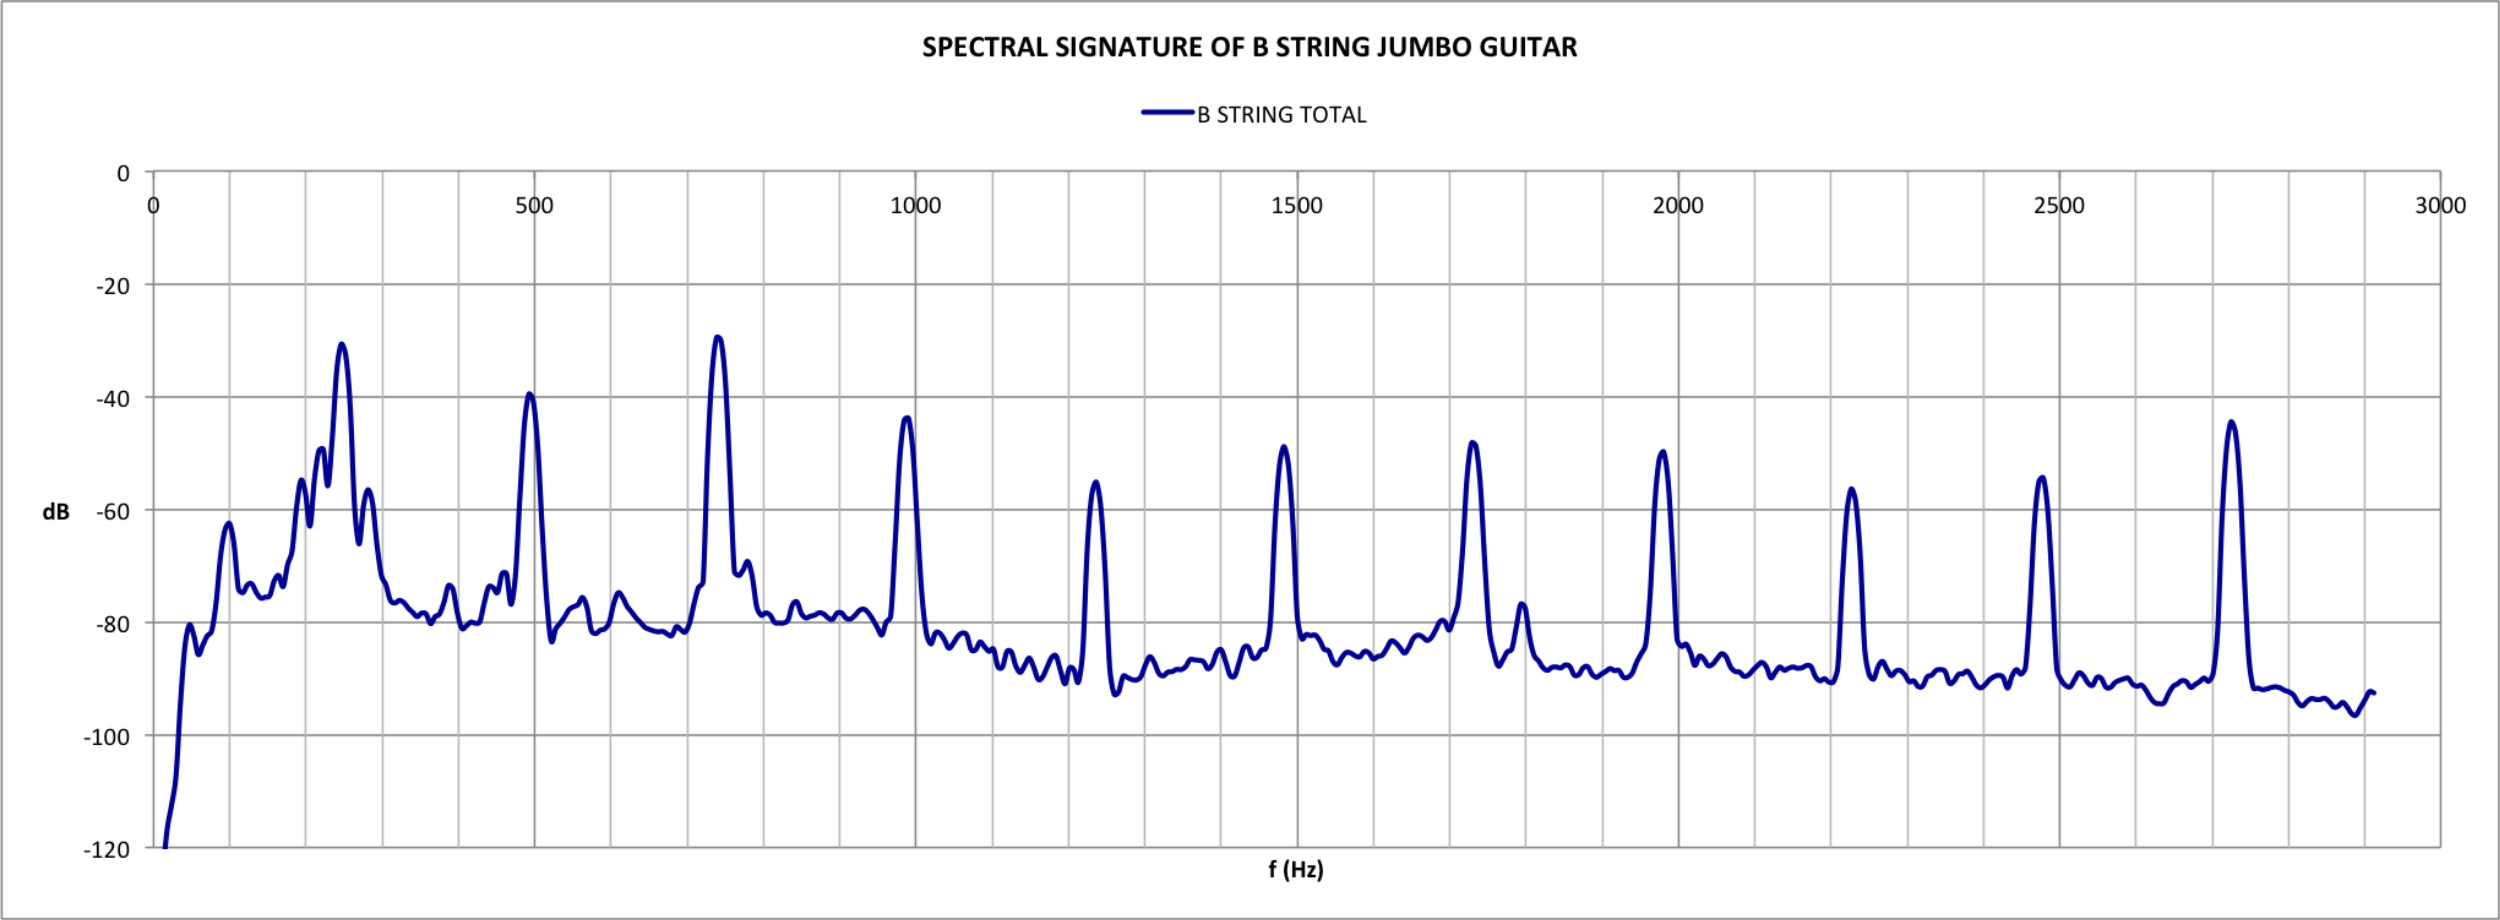
The peak frequencies in order are:
- 246.1Hz (B3 is 246.9Hz)
- 492.2Hz (an octave above, B4 is 493.9Hz – double 246.6Hz)
- 738.3Hz (F#5 is 739.9Hz)
- 990.2Hz (B5 is 987.8Hz)
- 1236.3Hz (D#6 is 1318.5Hz)
- 1482.4Hz (F#6 is1480.0Hz)
- 1728.5Hz (somewhere between G# and A6)
- 1980.4Hz (B6 is 1975.5Hz)
- 2226.6Hz (C#7 is2217.5Hz)
- 2478.5Hz (D#7 is 2489.0Hz)
- 2724.6Hz (somewhere between E and F7)
Those with a music theory background will recognise B, C#, D#, E, and F# as notes in the B Major scale. This is what’s known as a harmonic series – more about these in another blog entry.
